
How I Cut AWS Debugging Time by 90% as an Intern (With Zero Prior Cloud Experience)
Contents
When I joined Velaris.io as a Software Engineering intern, I had around 3 years of project-based web dev experience — React, Node.js, Tailwind, APIs — but no idea what it looked like to work inside a real production system at scale. Day 1 changed that pretty fast.
My team was handed a real problem: Velaris is a Customer Success Management (CSM) platform integrating with dozens of third-party services — Salesforce, HubSpot, Zendesk, and more. At that scale, things break. And every time something broke, the engineering team had to perform what I started calling an “archaeological dig” — log into AWS Console, navigate to CloudWatch, sift through log groups, filter timestamps, search for keywords, and eventually find the root cause before they could even start fixing it.
Here’s how we built a serverless dashboard that reduced incident diagnosis time by 90%, starting with zero cloud knowledge.
The Problem: Finding the Needle in the CloudWatch Haystack
To get an idea of the scale: we were dealing with around 147 log groups, roughly 2.3 million log entries per day, and around 50 different event signatures to track inside a single log group.
The internal team was spending on average 20 minutes just finding the problem before they could start fixing it — approximately 18 hours per week on this manual process alone. That’s half a full-time engineer’s capacity, just navigating errors, not solving them.
They didn’t need an enterprise-grade observability platform with machine learning anomaly detection. They needed something simpler: a window into the chaos that would instantly flag “this integration is failing for this customer.”
Stop. Plan First. Code Later.
My instinct coming from personal projects and freelance work was to open VS Code and start building immediately. This project cured me of that habit pretty quickly.
We didn’t write a single line of code for the first three weeks.
Instead, we went through the kind of planning process that you don’t do when you’re building for yourself. We drafted and revised our proposal three times before getting stakeholder sign-off — each revision because we learned something new about how the team actually worked vs. how we assumed they worked. We did cost analysis because on AWS, every Lambda invocation, every CloudWatch query, every API call has a price — and shipping a tool that accidentally spikes the cloud bill is not a good look for an intern team. We also had our first real experience with scope creep — learning to say “yes, and we’ll add that in the next iteration” instead of just saying yes to everything.
Looking back, those three weeks are why this shipped as a production tool used by 30+ internal users rather than a polished prototype that got quietly shelved.
Taming the Data (The Technical Challenge)
The biggest challenge wasn’t building the dashboard — it was getting the data into a shape the dashboard could actually use.
The company’s microservices architecture meant every team logged differently. No centralized standard. No structured format. Just strings — thousands of variations of strings. We couldn’t query a database because the data we needed didn’t exist in a structured form yet.
The Investigation and The Pipeline
I had to step out of the IDE and into the organization — meeting rooms, Slack huddles, online calls. Over a week, we ran Knowledge Transfer (KT) sessions with different dev teams to reverse-engineer their logging patterns. The output was a master spreadsheet mapping all tenants, integrations, events, schedulers, and log groups — 30+ pages, 1,200+ entities to track.
With that, I built a data pipeline using LLMs to parse the chaotic log patterns into structured JSON objects, which we then seeded into the database via a seed script to create a reliable “map” for the dashboard. Every AI output went through automated validation and manual review before it touched the database.
This meant we could query dynamically using relational data instead of writing and maintaining hundreds of brittle RegEx parsers for each log variation.
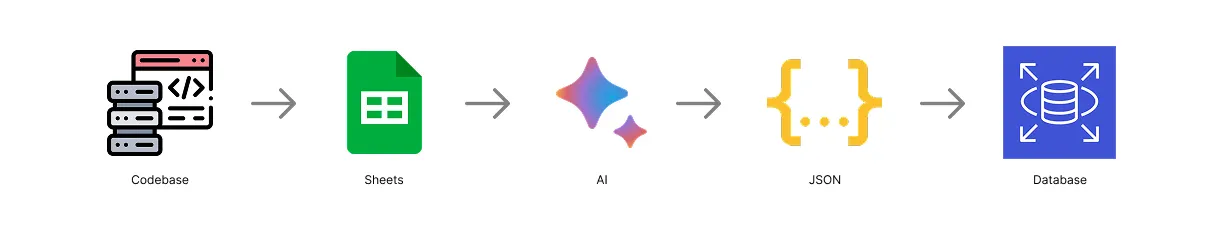 The pipeline: raw, unstructured CloudWatch logs → LLM normalization → structured JSON → seeded database
The Serverless Architecture
For a tool like this — unpredictable usage, spiky traffic, no need for always-on infrastructure — serverless was the obvious call. Here’s what we landed on and why:
Frontend: React + TypeScript + Tailwind + ReCharts
A single-page app with real-time updates via polling. We considered WebSockets but it was overkill for a monitoring tool that refreshes every few seconds. Deployed to S3 + CloudFront for CDN distribution.
Backend (API Layer): Node.js with Fastify + AWS API Gateway
We chose Fastify specifically over Express because of its lightweight footprint and low overhead — which matters a lot in a Lambda environment where every millisecond of cold start time counts. It also has first-class support for Lambda via @fastify/aws-lambda.
Backend (Data Collection Layer): AWS Lambda + AWS EventBridge + AWS RDS
EventBridge triggers Lambda on a schedule to pull from CloudWatch and update the database. Pay only for compute used — no idle servers.
Data: AWS CloudWatch + Activepieces + SQS
CloudWatch is the source of truth for logs. Activepieces handles workflow monitoring. SQS queue health is tracked and surfaced directly in the dashboard.
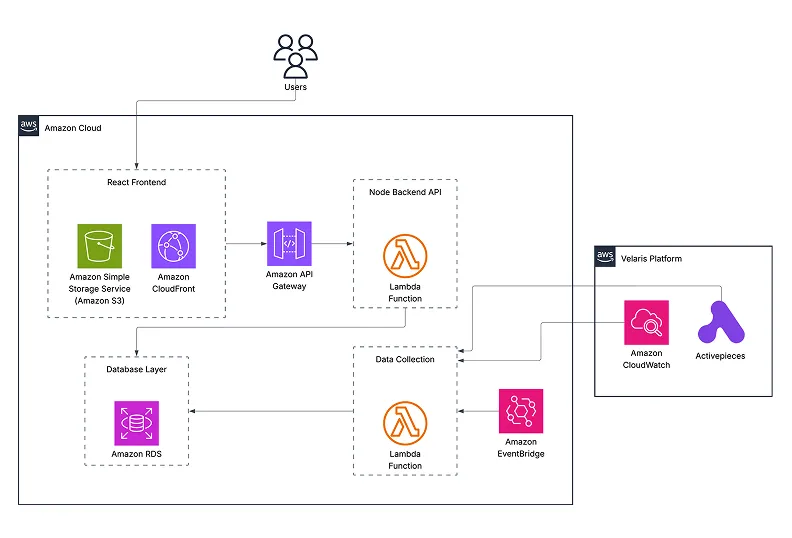 Full architecture: React SPA → API Gateway → Lambda → RDS, with EventBridge-scheduled sync from CloudWatch
Challenges and Solutions: What Went Wrong (And How I Fixed It)
Lambda Cold Starts
Problem: Lambda functions sit idle between requests, which means the first call after a period of inactivity triggers a cold start — slow initialization before your actual code even runs.
We tackled this a few ways. The Fastify choice already helped with the lightweight startup. On top of that, we initialized the app instance and database connections outside the handler scope so only the very first cold start pays that cost — subsequent requests reuse the container. We also used tsup to minify the build and exclude the AWS SDK from the bundle, cutting artifact size and speeding up the unpacking step. For an internal tool, a small startup delay is acceptable, but these changes kept it from being noticeable.
CloudWatch API Rate Limits
Problem: AWS CloudWatch has TPS limits per account/region for StartQuery and GetQueryResults — hit them and your queries start failing silently.
I implemented a custom Semaphore to cap concurrent queries at five, staying within AWS account limits. I also batched requests — grouping up to 15 entities into a single query using combined regex filters — which dramatically reduced the total number of StartQuery calls. A one-second polling interval on GetQueryResults kept us from burning through that quota. Delta syncing — only querying the time window since the last update — kept individual executions fast, backed by the SDK’s built-in exponential backoff for anything that did hit a limit.
Complex Schema Design
Problem: We started with separate tables (events, internal_tasks, ap_flows) for different integration types, which made querying global health metrics painful and inefficient.
I redesigned the schema around a unified entities table as a polymorphic parent for all trackable items, with SQL CHECK constraints enforcing valid relationships based on entity type. This centralized our metrics collection logic and simplified dashboard queries significantly. Drizzle ORM handled the schema migrations incrementally — moving data from legacy tables to the new structure with no downtime and no data loss.
Scope Creep
Problem: The project kept growing in ways we didn’t plan for, and the schema and architecture had to keep up.
We started with a simple scope: monitor tenants and their integrations. That felt manageable. Then the scope expanded to include events and internal schedulers tied to each integration. Then SQS queue monitoring was added as a new feature entirely — health checks and failure detection for queues across tenants. Each expansion meant revisiting the schema, the data pipeline, and the dashboard UI.
Authentication was another one. Initially the dashboard was only accessible over an internal VPN connection — fine for an internal tool in its early days. But as the user base grew to include people outside that VPN setup, we had to properly implement OAuth with Google Sign-In on top of the existing access model. That wasn’t in the original scope at all.
The lesson was learning to absorb scope changes without losing momentum. Every new requirement got triaged — does this go in now, or does it go in the next iteration? Having that discipline is what stopped the project from collapsing under its own ambitions.
CloudWatch Cost Spike
Problem: We had no idea how CloudWatch Insights pricing actually worked until the AWS bill arrived and our DevOps Head had to shut down the collector.
CloudWatch Insights charges based on the volume of data scanned per query — not just the data returned. We knew this in theory. What we missed in practice was that the Start and End time parameters we were passing were going into the query string as filters, not as actual CloudWatch query time bounds. CloudWatch was essentially ignoring them and scanning the entire log history for each query. By the time this was caught, a single run was scanning around 300TB of data — at CloudWatch Insights pricing, that adds up fast. The collector was shut down for a day or two while we investigated.
There was a secondary problem compounding this. We had a manual retry loop on StartQuery calls — when a query failed, we’d retry. But CloudWatch queries don’t stop when your program stops; they keep running on AWS servers. So failed queries would retry, new queries would pile up, rate limits would get hit, those would trigger more retries, and the cycle would escalate. A chain of errors that each made the next one worse.
The fix had two parts. First, I rewrote the query strategy — switching from per-tenant individual queries to aggregated log-group queries using multiple parse expressions in a single query. This dropped our query volume per Lambda run from ~60 queries to 11 (an 82% reduction) and eliminated the redundant full-history scans by roughly 80%. Second, we removed the manual retry loop entirely, relying instead on the AWS SDK’s built-in 3-attempt exponential backoff, which is smarter about not hammering a rate-limited endpoint. We also added query tracking so that if the program is shut down mid-run, any in-flight queries are detected and cancelled on the next startup rather than left to run and charge.
The result was an ~80% reduction in CloudWatch costs. Understanding the pricing model is part of understanding the architecture. We found that out the hard way. We learned that lesson at AWS’s expense. Literally.
Impact: 90% Faster Resolution
What used to be a 15–20 minute process of navigating AWS menus is now a 2-minute check. Internal staff can monitor tenant health on-demand and jump straight to the relevant error log, bypassing the AWS console entirely.
18 hours a week of manual debugging time, gone.
Key Takeaways for Aspiring Software Engineers
1. Production Engineering is 20% Coding, 80% Everything Else
The actual React components and Lambda functions? Maybe 40 hours of work. Requirement gathering, cost analysis, testing, documentation, and stakeholder management? 120+ hours. Real software engineering is about solving organizational problems, not just technical ones.
2. Serverless is Not Always the Answer (But It Was Here)
I came in thinking “serverless = modern = better.” Serverless has real tradeoffs: cold starts, vendor lock-in, debugging complexity. For this use case — unpredictable traffic, spiky usage, minimal state — it was the right fit. For a different project, it might not be. Understand the architecture before you follow the trend.
3. AI is a Tool, Not a Magic Wand
I used Gemini, Claude, and Perplexity across the project. They genuinely sped things up. But AI gives you an answer, not always the best answer. I ran into hallucinations, bugs, and syntax errors regularly — the key was always cross-checking across references and models, and breaking tasks down small enough that the AI had less room to go wrong. AI accelerates work. It doesn’t replace thinking. AI is the tool – You are the orchestrator.
Models used: Gemini 2.0 Flash, Gemini 2.5 Pro, Claude Opus 4/4.5, Claude Haiku 4.5
4. User Feedback > Your Assumptions
We built a graph view showing error trends over time. I was proud of it. Users ignored it completely. What they actually wanted was a red/green status indicator and a “copy log group to clipboard” button. Ship fast, get feedback, iterate. Don’t fall in love with features users don’t need.
5. Document Everything, Especially When You Don’t Want To
Future me at 2 AM debugging a production issue was very grateful that past me wrote clear inline comments and kept a troubleshooting wiki. Documentation feels like overhead right up until it’s the only thing standing between you and complete chaos. With AI it’s easier than ever. No excuses.
Final Thoughts: From Intimidated Intern to Slightly Less Intimidated Engineer
I started this internship intimidated by AWS. I’d never touched CloudWatch, didn’t know what Lambda was, and honestly thought “serverless” was just marketing language.
Three months later I’d helped build a production system that processes millions of log entries per week, serves dozens of internal users daily, and measurably saves the company time and money.
The biggest lesson? Technical skills are learnable. The problem-solving mindset is what actually matters. I didn’t build this because I already knew AWS — I built it because I understood the pain point, broke it down into solvable pieces, and figured out what I needed along the way.
If you’re a student or early-career engineer reading this: you don’t need to know everything before you start. You need curiosity, persistence, and the willingness to ask questions. The rest is just documentation, Google, and AI.
Connect With Me
I’m in my second year of a BSc in Computing, majoring in Software Engineering, and actively looking for opportunities in cloud architecture, backend, or full-stack engineering.
- LinkedIn: hirusha-dinil-rubasinghe
- GitHub: github/lxnid
- Portfolio: dinilr.com
- Email: me@mail
If this breakdown was useful, share it with someone who could use a real look at what building production software actually involves.